Dashboard List
Below we have a list detailing each option you have for your Dashboard Widgets
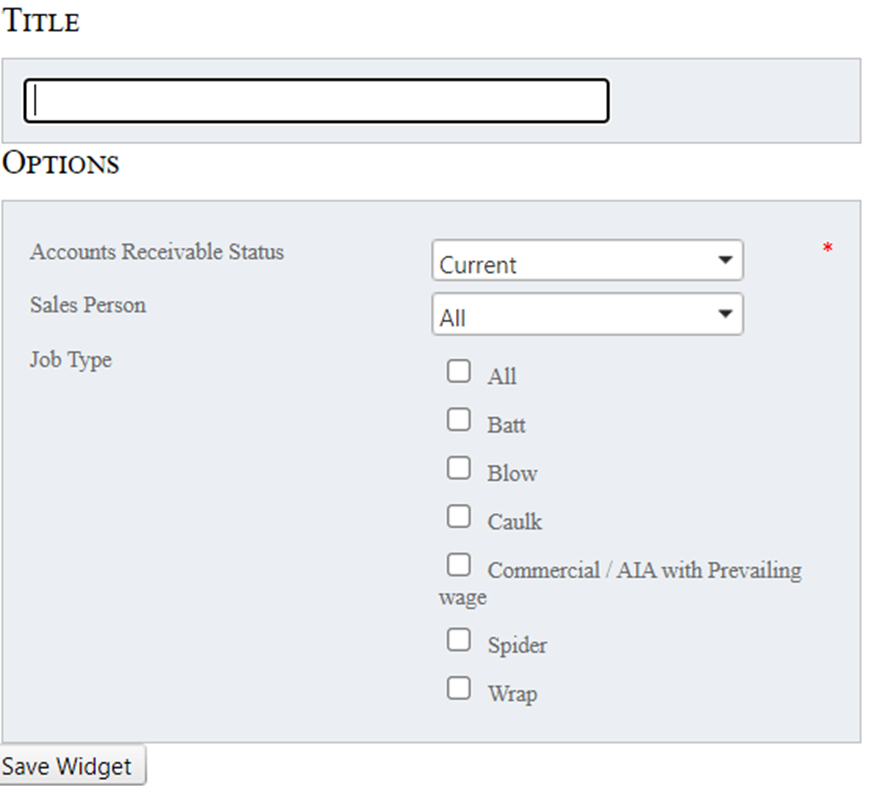
Accounts Receivable--This widget displays Open Invoices in four different categories: Current, greater than 30 days, greater than 60 days, and greater than 90 days. The information can be filtered further by salesperson and job type.
Activity Overview-- This widget displays a total count of datasheets, bids, and jobs entered. This is filtered by the status of the datasheets/bids/jobs and by salesperson.
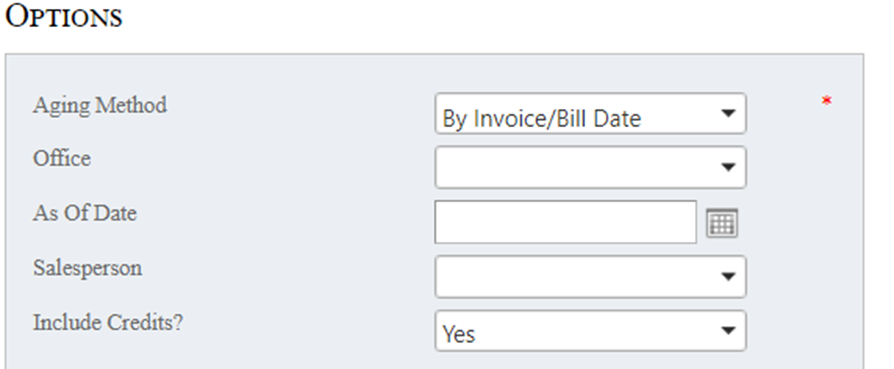
Aging Report-- This widget displays information from an Accounts Receivable Aging report. It can be filtered by the Aging Method (by invoice/bill date, by due date, by bid), the Office, As of Date, Salesperson, and whether or not to include the credits.
Alerts--This widget displays any of the Next Call Dates that have been set up for the user who adds this widget to their dashboard. The alerts will appear on the day they are scheduled and will remain on the widget until they are resolved.
Bid and Job Status Counts-- This widget displays the count and totals for all Data Sheets, Bids, and Jobs assigned to you by status.
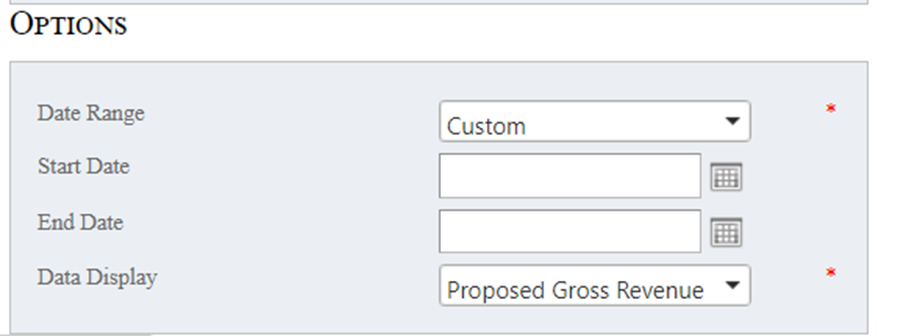
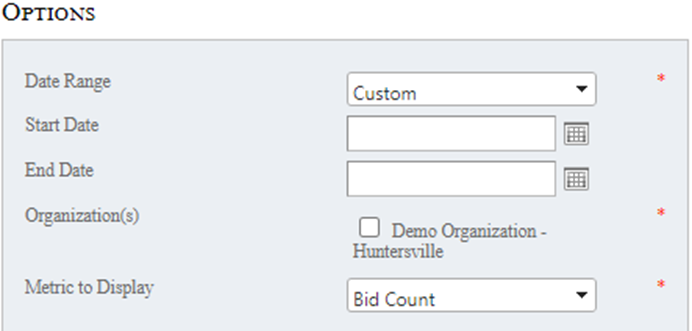
Bid Totals by Salesperson Pie Chart--This is a pie chart that displays the total number of bids or the bid amount total by salesperson. You have the option of setting a Custom date range or having this report be filtered by Week to Date, Month to Date, Year to Date, Previous Month, Previous Year, Last 30 days, and Last 7 days. You can also set the ‘Data Display’ to Proposed Gross Revenue or Bid Count.
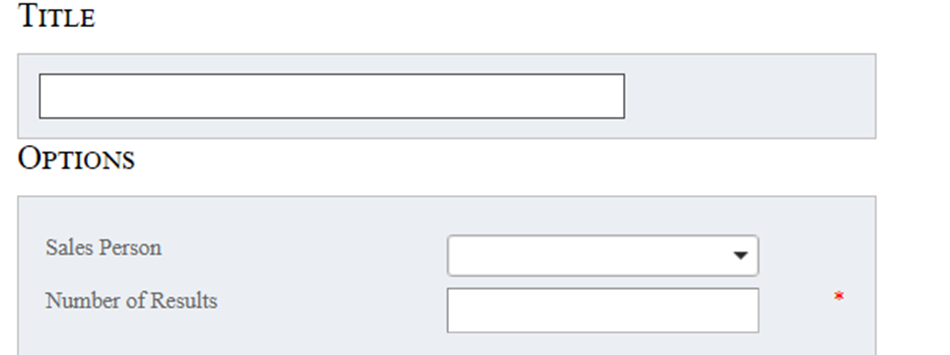
Bids - Quick Listing-- This widget displays a list of the last several bids entered into the system, showing the quote amount and status for each bid. It can be filtered by salesperson and how many results you’d like to see.
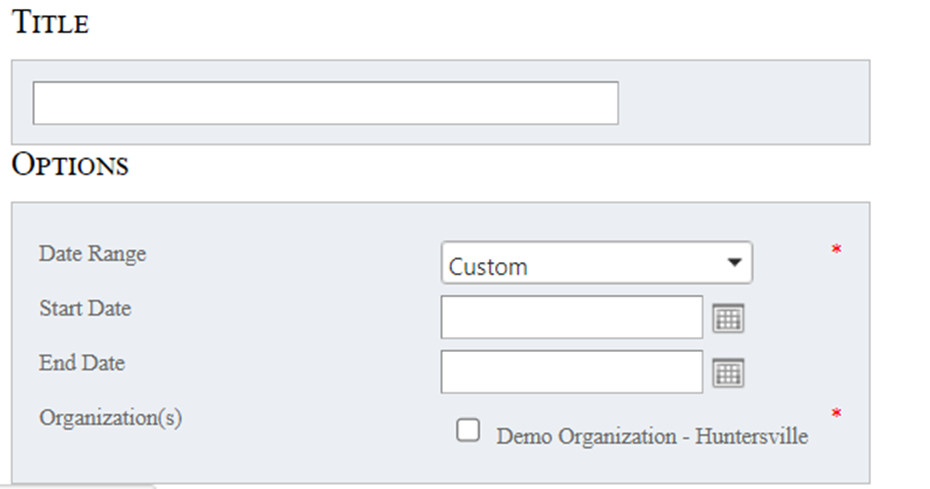
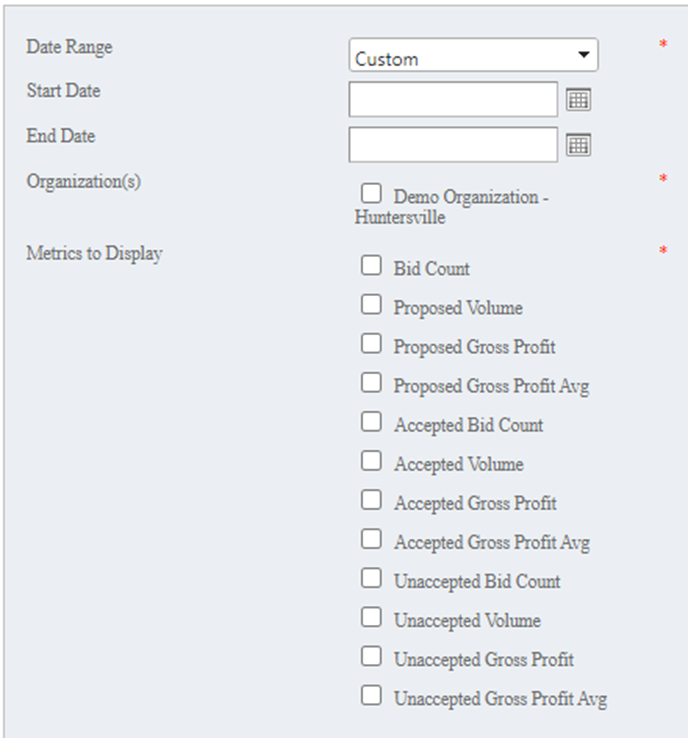
Bids By Sales Person-- this widget displays a grand total of bids entered into your system. You have the option of setting a Custom date range or having it be filtered by Week to Date, Month to Date, Year to Date, Previous Month, Previous Year, Last 30 days, and Last 7 days. You can also set the ‘Data Display’ to Proposed Gross Revenue or Bid Count. The information displayed includes a Bid Count, The Proposed Gross Revenue and the Proposed Gross Profit Avg. Once you have this widget set up, click the grey plus sign to the left of ‘Grand Total’ and your bids will be expanded by ‘Office’. You may also expand the ‘Office’ portion to see bids sorted by salesperson. This will detail how many bids have been entered by each salesperson located in that office.
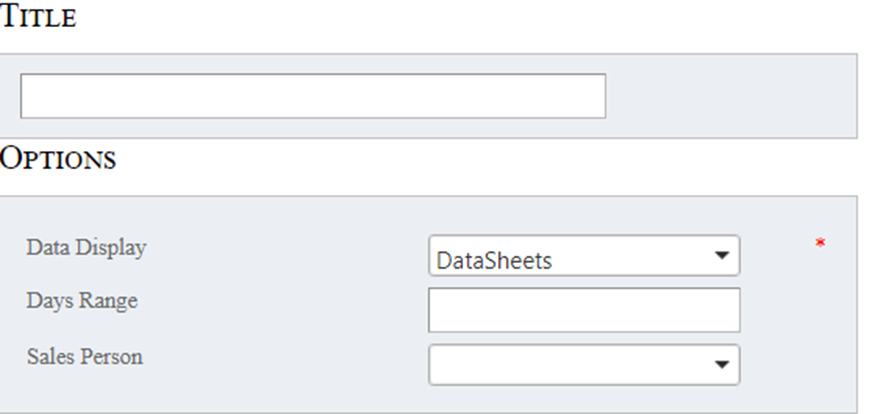
Counts By Status Pie Chart--This widget will display a count and total for either Datasheets, Bids, and Jobs within a pie chart. This data can be filtered through a range of days and by salesperson.
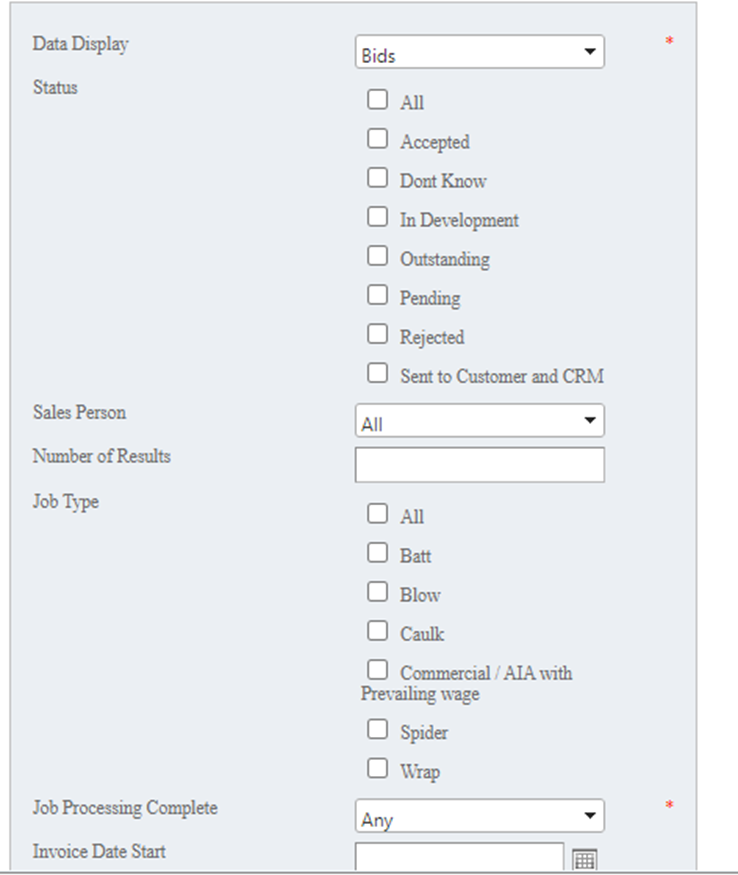
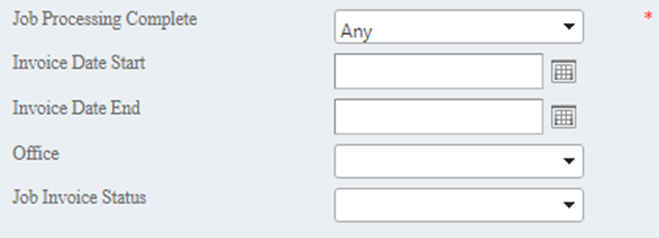
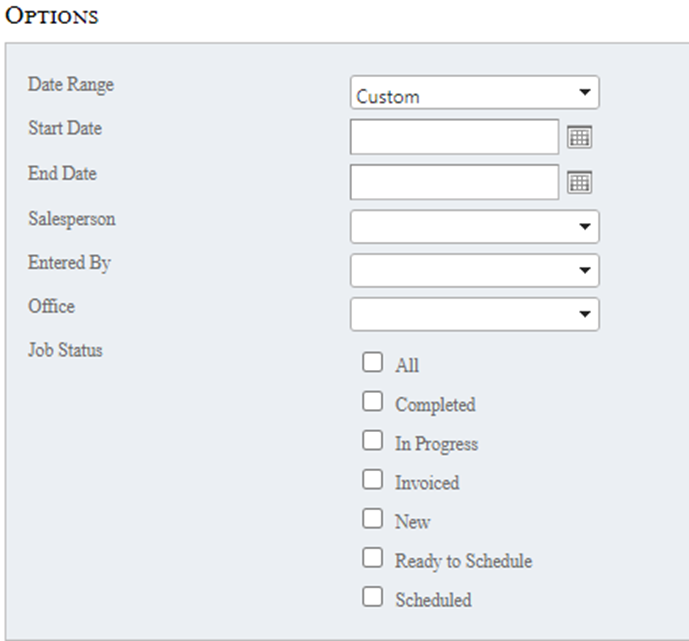
Datasheets/Bids/Jobs/Work Order-By Status--This widget displays information connected to Datasheets, Bids, and Jobs. The Name, Customer, Sub-total, Tax, Total Amount, Status, and Date Entered are displayed. When filtered by Job, the additional columns of Invoiced amount and Remaining to Bill are also displayed. When setting up your Widget, you have the option of filtering your results by Status, Sales Person, Number of Results, Job Type, whether or not the Job Processing has been completed, Invoice Start and End dates, which Office is connected, and the Job Invoice Status.
Equipment Calendar--This widget is a weekly calendar that displays any job(s) assigned to each piece of equipment within your organization.
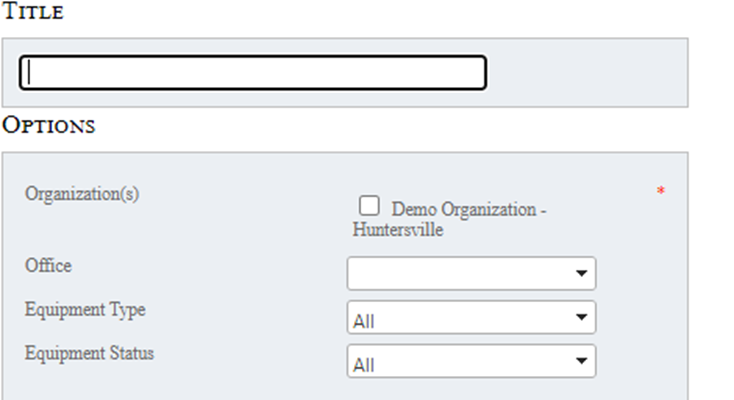
Equipment Dashboard--This widget displays information connected to all the equipment that has been set up within your organization. You will be able to see the Equipment Name, Description, Status, date of the Last Survey, and any Notes that have been entered. When setting up this widget you have the option to filter by Office, Equipment Type, and Equipment Status.
ESign Status Overview-- This widget displays the eSign Status for your open Bids. It will display the Type, eSign Status, Number entered with that status, a Sub-Total, Tax, and Bid Total. When setting up this widget you can filter your results by Office and by Sales Person.
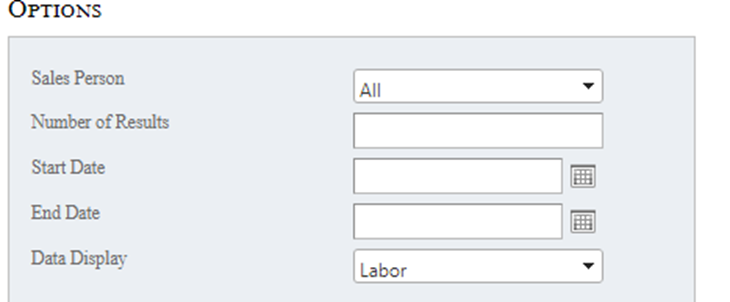
Estimated vs Actual Labor Comparison--This widget displays a comparison between the estimated and actual labor or material cost per job. It will show the Job #, Name, Salesperson, Estimated cost, Actual cost, and the Difference between them. The results can be filtered by Salesperson, the Number of Results you want to see, a Start and End Date, and whether you want data from Labor or Material.
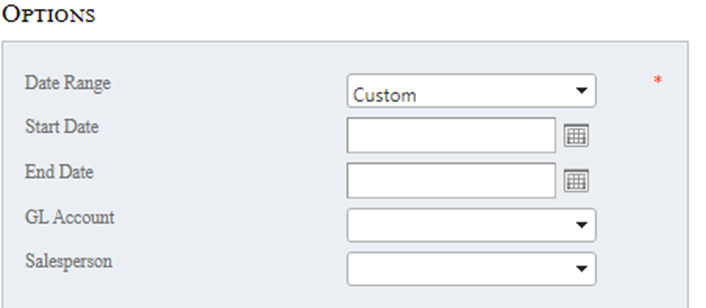
GL Sales Report--This widget is a listing of all items sold, grouped by GL account for easy accounting. This information can be filtered by a Date Range, GL Account, and Salesperson.
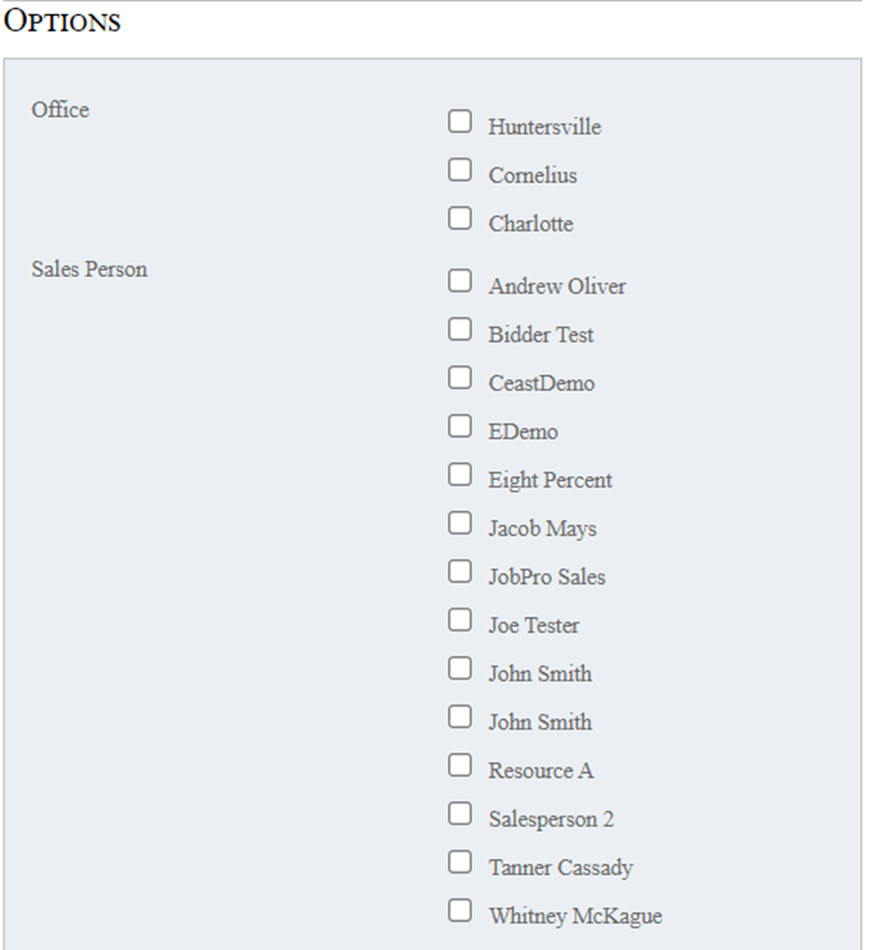
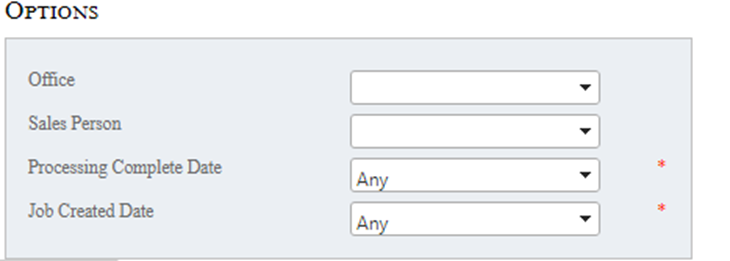
Gross Profit--This widget displays a Gross Profit report for your organization. Results can be filtered by Office, Sales Person, Processing Complete Date, and Job Created Date.
Job Calendar--This Widget displays a calendar that includes any jobs scheduled. The calendar can be set to display information by the Day, Week, Month, or a Timeline (which will display jobs scheduled on the current day first followed by the next 4 days of the week).
Job Closing Rate-- This widget displays the job closing rate (time a bid is in the bid phase) per sales person. You will be able to see the Total Bids entered, # that have been closed, the average days it took to close, and the close rate per sales person. Results can be filtered by a custom date range, Week to Date (WTD), Month to date (MTD), Year to Date (YTD), Previous Month, Previous Year, Last 30 Days, and the Last 7 days.
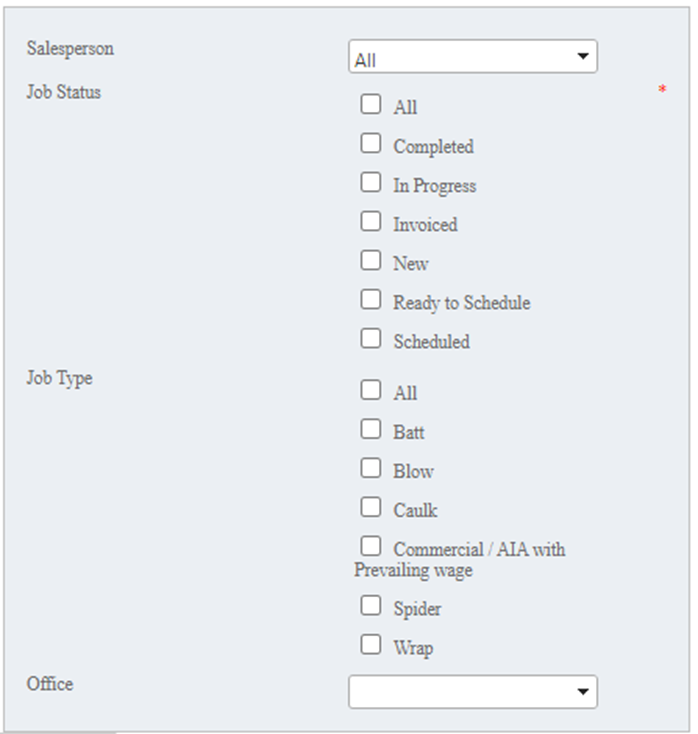
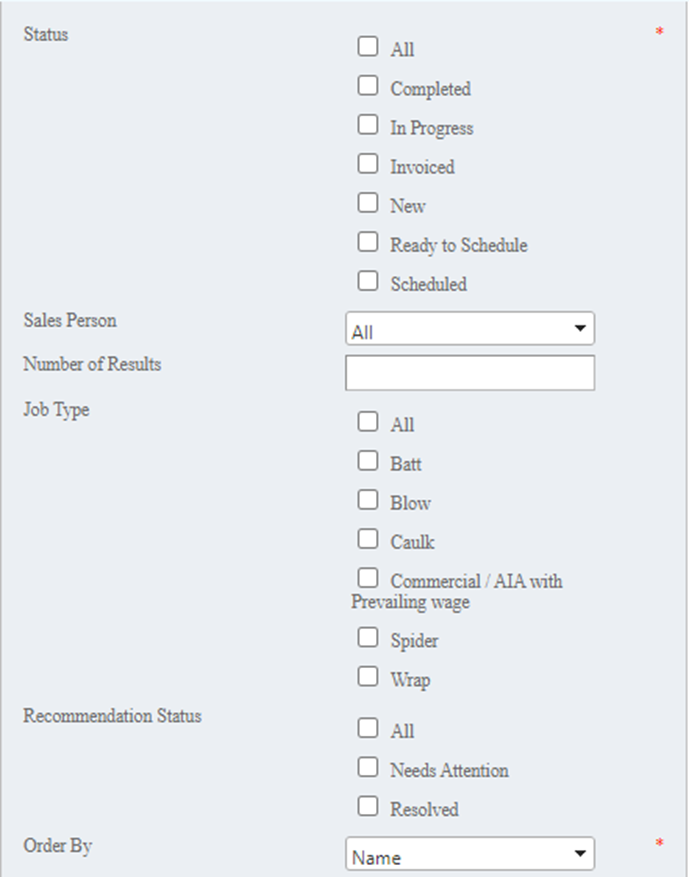
Job Listing--This widget contains a list of the open jobs in your organization. Results can be filtered by Job Status, Sales Person, the Number of Results you need to see, Job Type, and Recommendation Status. You may also choose from a variety of options that determine how your results are ordered.
Job Recommendations--This widget will display a list of your job recommendations. The results can be filtered by a Date Range, Salesperson, who it was Entered By, Office, and Job Status.
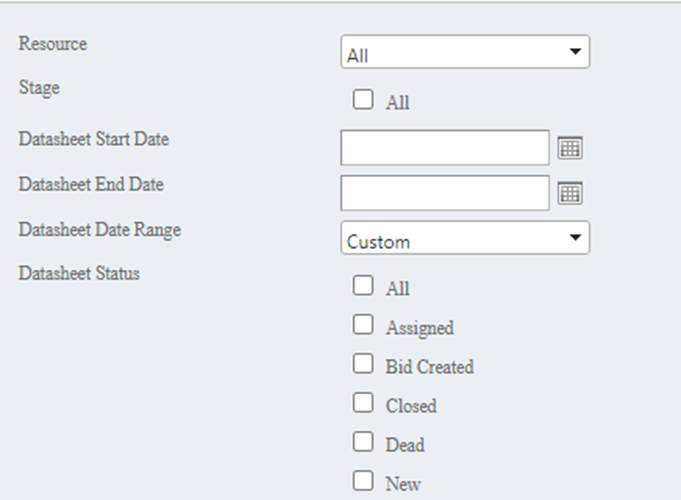
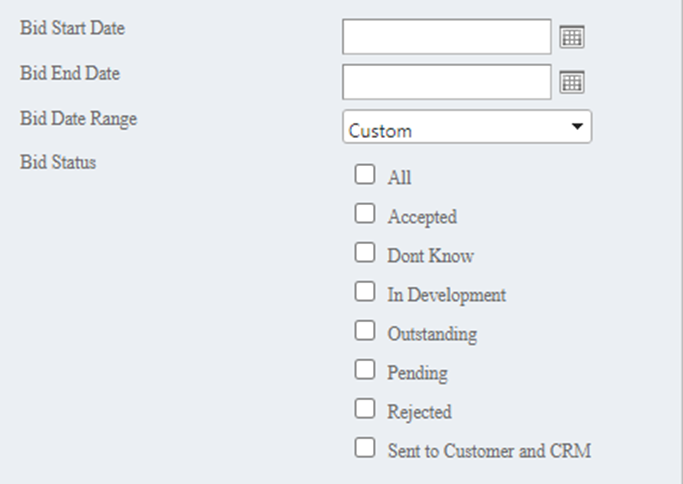
Job Stage Report--This widget displays a ‘Job Stage Report’. This report includes a listing of jobs that also displays information on the stage each job is currently in. These results can be filtered by Resource, ‘Stage’, Datasheet date range, Datasheet Status, Bid Date Range, and Bid Status.
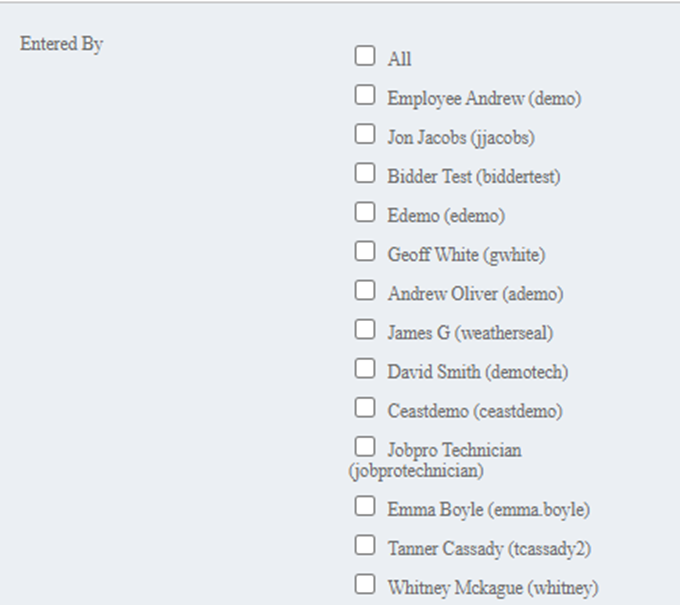
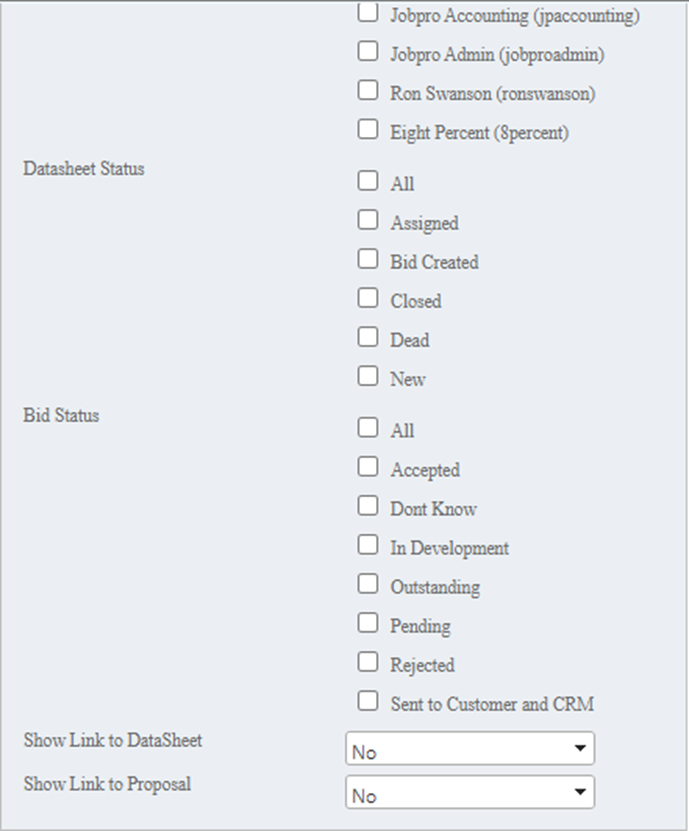
Job Tracking--This widget displays all the jobs in your organization. Results can be filtered by Entered by, Datasheet Status, and Bid Status. You also have the option to show a link to the datasheet or proposal. When this widget is set up, you have the option to search within the widget by Name, Customer, Resource and Status.
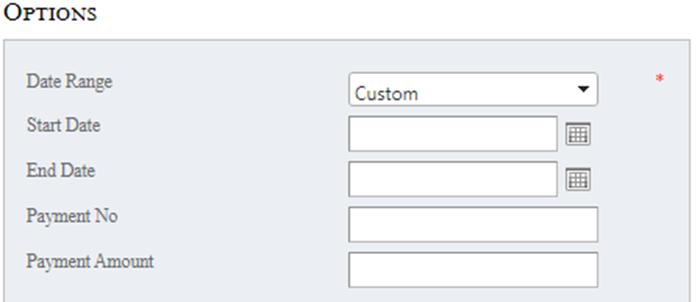
Open Payments Report--This widget displays a list of payments not associated with an invoice. Results can be filtered by Date Range, Payment Number, and Payment Amount.
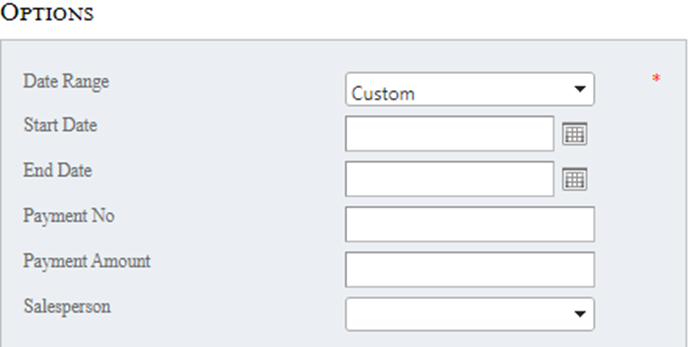
Payment Method Report--This widget will display a list of payments grouped by the payment method. Results can be filtered by Date Range, Payment number, Payment Amount, and Salesperson.
Sales By Product Line Chart--This is a chart that will display your organization’s sales by product. You can filter your results by a time period (WTD, MTD, YTD), your Organizations Product Line, and Salesperson. You also have the option to Combine the product lines and/or use demo data.
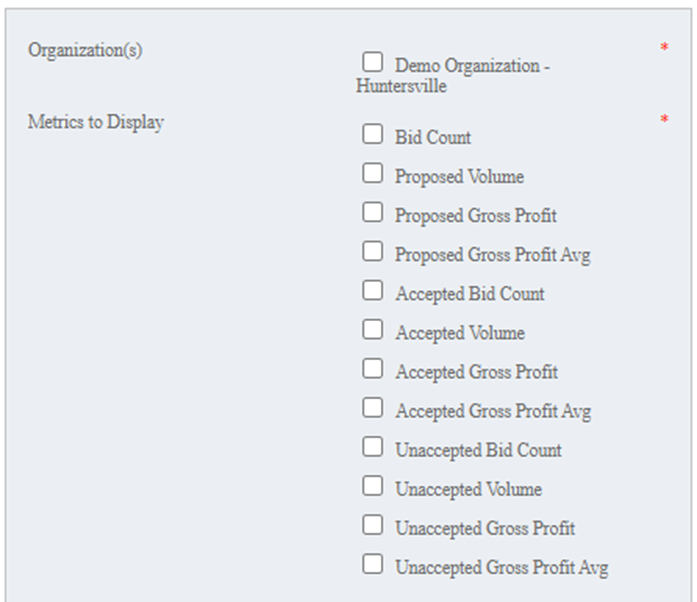
Sales Person Rankings--This widget will show a ranking of your sales people. You can base these rankings on a certain Date Range and you can choose which metrics you’d like to display.
Sales Person Weekly Rankings Line Chart-- This widget is a line chart that shows the weekly rankings of your salespeople. Your results can be filtered by a date range and you can choose what metric you’d like to display.
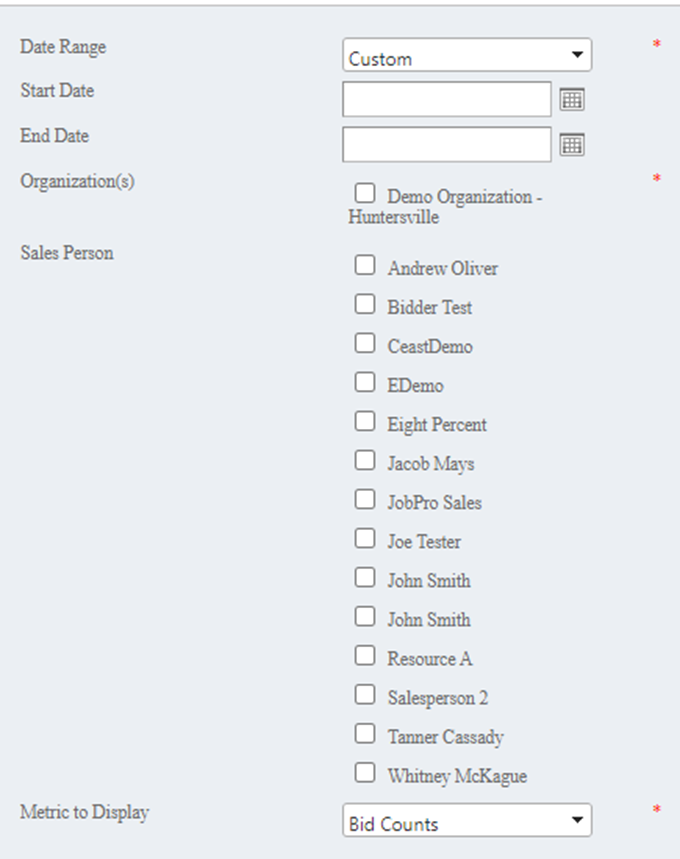
Sales Person Weekly Totals Line Charts--This widget is a line chart that displays the weekly totals per sales person. You have the option to choose a date range, which sales people are displayed, and the metric to display.
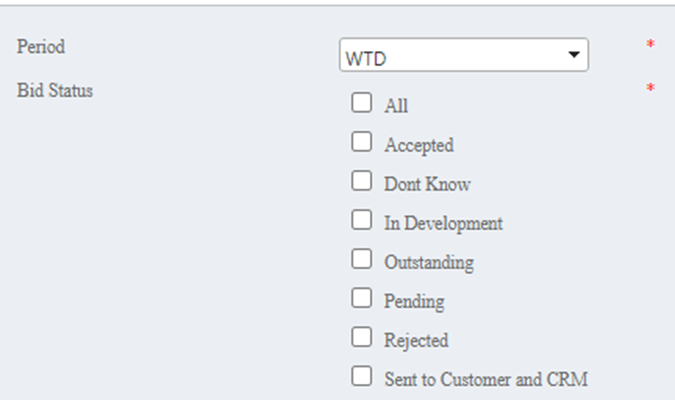
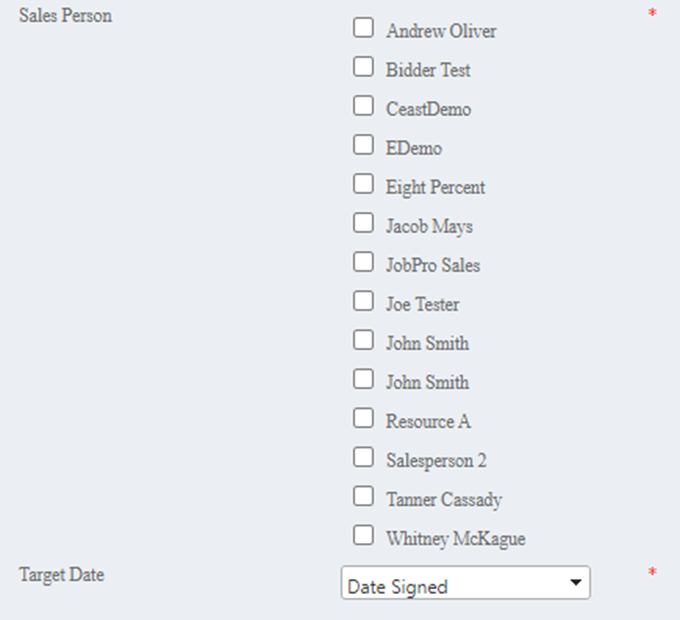
Sales Pipeline--This widget displays a total upcoming sales per salesperson based on the bid status and target date that you choose. Results can be filtered by time Period (WTD, MTD, YTD), Bid Status, Sales Person, and Target Date.
Salesperson Month To Date Totals-- This widget displays each salesperson’s Month to Date Totals. You have the option to choose which metrics you’d like to display as well.

Salesperson Week To Date Totals--This widget is the same as the ‘Salesperson Month To Date Totals’ except this one is by Week instead of Month. You have the same option to choose which metrics you’d like to display as well.
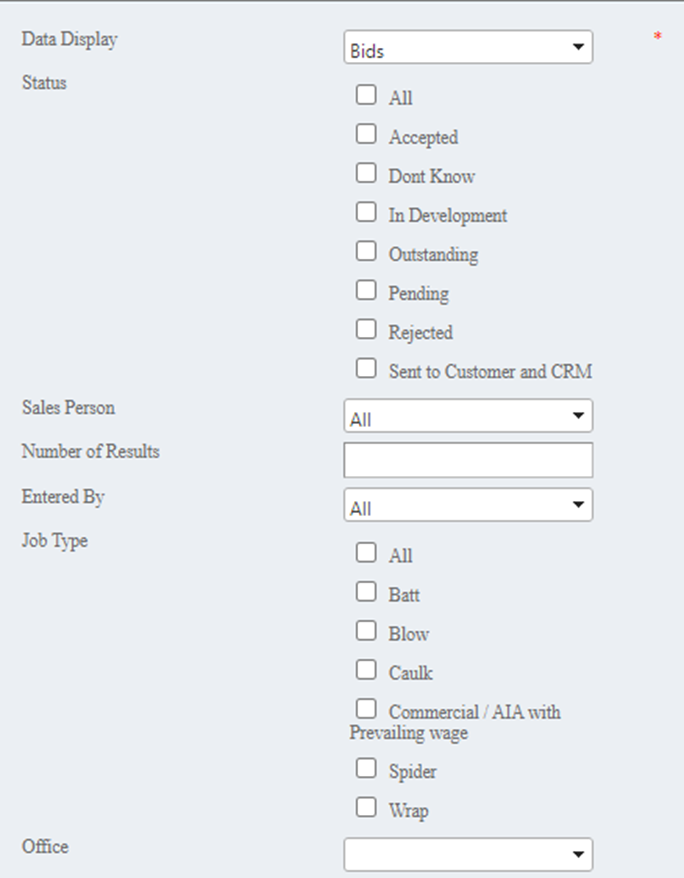
User Store--This widget displays information from either Bids, Datasheets, or Jobs. Results can be filtered by Status, Sales Person, Number of Results , Entered By, Job Type, and Office.
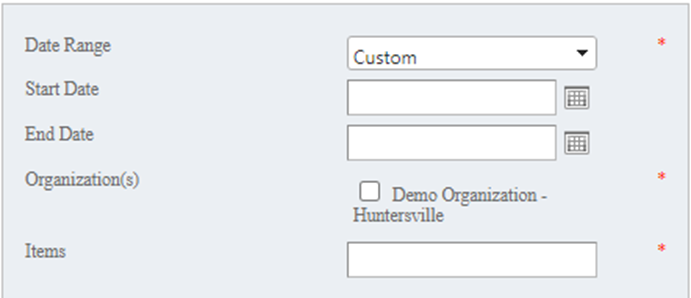
Weekly Item Pricing Averages--This widget uses a line graph to display the average price for one or more items by week, comparing accepted and unaccepted bids. Choose a date range you’d like to see displayed and enter the Item ID or ID’s (separated by a comma) you want to display. Item ID’s can be found to the left of the item name when you search for items in the Search dropdown.
WIP Report-- This widget displays a Work in Progress (WIP) report for your organization. Results can be filtered by Salesperson, Job Status, Job Type, and Office.