Master Sales Report
The Master Sales Report details the jobs that you have completed. Jobs must have completed processing to display in this report.
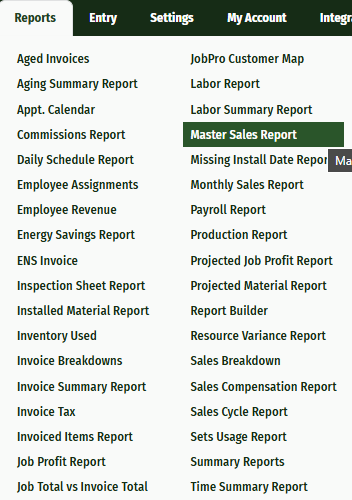
To run this report navigate to the ‘Reports’ tab on the main menu, click ‘Master Sales Report’

To filter the information displayed on the report, use the dropdown options at the top of the page.
Entity: This allows you to toggle between jobs, bids and datasheets, i.e., viewing the number of datasheets that have had jobs closed.
Metric: This limits which columns are viewed on the report. By switching this field to Dollars, only the columns with dollar amounts will show.
Function: This allows you to display the data as a Total or an Average. Total sums up all the jobs, while Average takes an average spread over those jobs.
Grouping: Grouping allows you to decide how you would like the information presented. On this example the grouping is Company/Office/Sales Person. This means that the information for the entire company is presented first, the information is then broken down into each office. By clicking into the offices tab, the information can be broken down further by each sales person.
Report Date: The report date captures all the information prior to that date.

Reload: If you change any of the data in the filters or grouping, you will need to click the 'Reload' button to generate the updated report.
Export to Excel: At any point in the report, you have the option to export this information to an Excel document on your computer.
TY : This stands for “this year,” showing the totals for that particular week, month, or year for this year.
LY : This stands for “last year,” showing the totals for that particular week, month, or year for the selected year.
% Co. : This stands for “percent of the company.” When the data is broken down between offices, you will be able to see what percentage each office is inputting into the organization.
MTD : Stands for “month to date.” This shows all the information for the month up to the report date.
YTD : Stands for “year to date.”
